
Plenty of people track their expenses, but far fewer track their asset trends. Bookkeeping focuses on individual transactions; an asset trend answers a longer-term question:
Is my net worth growing, flat, or shrinking? And are the individual asset classes moving in a healthy direction?
A spreadsheet works, but you end up maintaining tables, formulas and charts by hand. A third-party finance app works too, but then your balances live on someone else’s server. This post describes a local-first alternative that is easy to maintain for years:
Store the data in Markdown, aggregate it with DataviewJS, and render interactive charts with Charts.
Everything runs inside your Obsidian vault. There is no external database, and no financial data is uploaded to a third-party service. Once you append a single row of data, the total-asset trend, the per-category trend, the distribution chart and the account table all update automatically.
The Result
When you’re done, you’ll have a dashboard that shows:
- Your latest total assets
- The change since the previous snapshot
- A total-asset growth curve
- Per-category trends: bank accounts, payment wallets, stocks, funds, fixed income, and so on
- The latest category breakdown and its proportions
- The most recent balance or market value of every account
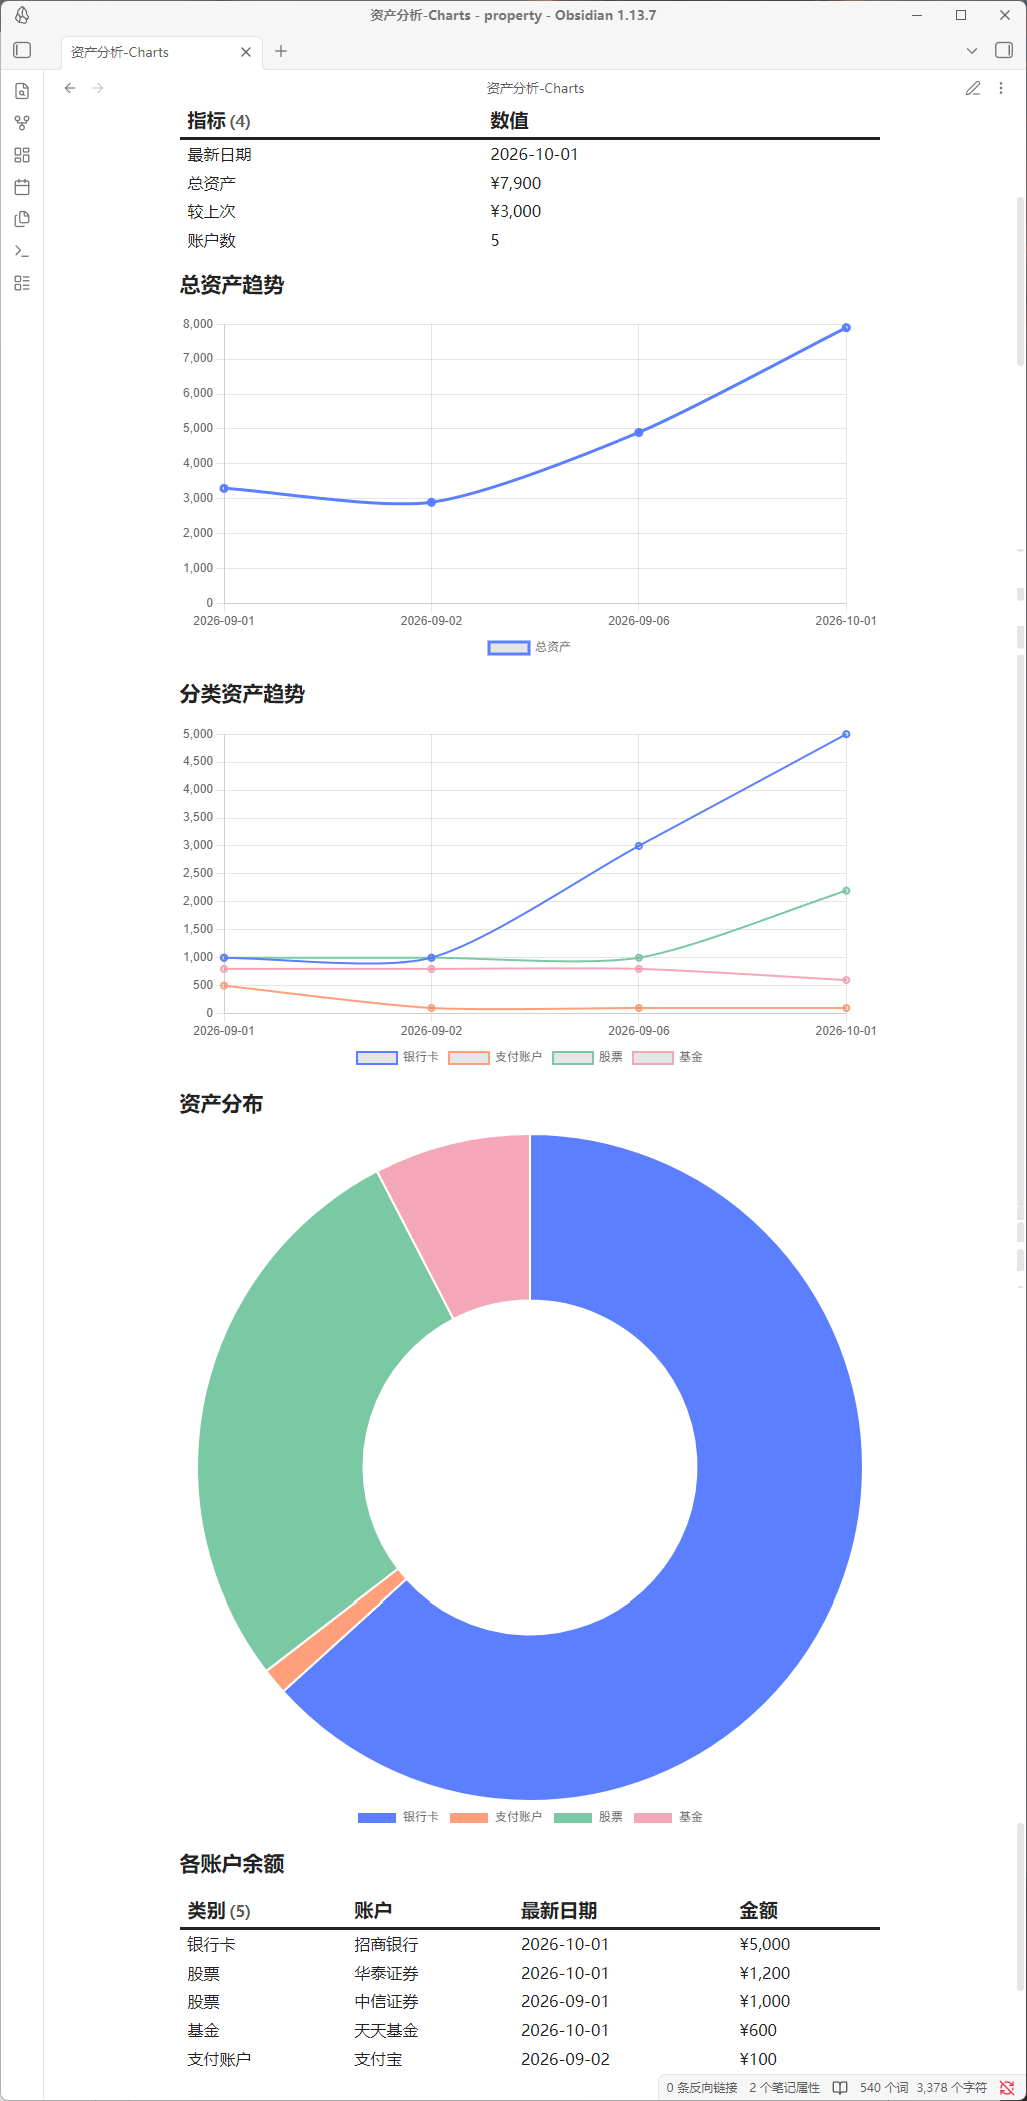
The goal isn’t a sophisticated financial model. It’s to solve the most common need with the lowest possible maintenance cost: watching your assets change over time.
How It Works
The setup relies on two Obsidian community plugins:
- Dataview — reads the Markdown data and performs the aggregation via DataviewJS.
- Charts — renders the computed arrays as Chart.js line and doughnut charts.
The division of labour is clean:
- A Markdown table stores the raw asset records.
- DataviewJS reads the table, carries balances forward, and computes totals per date and per category.
- Charts turns the computed results into visuals.
Install and enable both plugins under Settings → Community plugins. After enabling them, make sure Dataview’s JavaScript queries are turned on as well — otherwise dataviewjs blocks won’t execute.
File Layout
Create a property folder in your vault with the following structure:
| |
Where:
asset_snapshots.mdonly stores data.asset-trends.mdreads the data, computes the results and renders the charts.
Keeping data and presentation separate pays off: you can restyle the charts without touching your records, and add records without touching the dashboard code.
The Data Format
data/asset_snapshots.md stores everything in a plain Markdown table:
| |
The fields mean:
| Field | Meaning |
|---|---|
date | Record date, preferably YYYY-MM-DD |
category | Asset class, e.g. Bank, Payment Wallet, Stocks, Funds, Fixed Income, Other |
account | A stable account name, e.g. “ICBC Savings”, “Brokerage A” |
amount | The account’s current total balance or net value, in a single currency |
note | Optional remark, e.g. “initial”, “market move”, “after spending” |
One design decision matters most: amount is the account’s total at that point in time, not the day’s delta.
For a brokerage account, record “position market value + idle cash”. For a fund account, record the current total value. For a bank card, record the current balance. That way every account has one unambiguous value on any given date, which keeps the downstream math simple.
Why Record Only Changes
Re-entering every account on every snapshot gets tedious fast, and repeated manual entry invites mistakes. A change-only log works much better:
- On first use, enter an initial amount for every account.
- After that, add a row only when an account’s balance or market value actually changes.
- Accounts that didn’t change need no new row.
- The dashboard automatically carries forward each account’s most recent known balance.
For example:
| |
In this example:
- On Sep 3 only the brokerage account is updated; the bank card is left alone.
- On Sep 5 only the bank card is updated; the brokerage account is left alone.
- When computing the Sep 5 total, the dashboard uses 48000 for the bank card and the most recent 122000 for the brokerage account.
This trades a little extra logic in the code for a large reduction in day-to-day effort.
The Dashboard Code
Below is the core of asset-trends.md. Drop it into a single dataviewjs code block:
| |
The script does a handful of things:
- Loads the Markdown table from
data/asset_snapshots.md. - Converts each row into a JavaScript object.
- Collects the distinct dates, accounts and categories.
- For each date, resolves every account’s most recent known balance.
- Aggregates total assets, per-category assets and per-account balances.
- Calls the Charts plugin to render the line and doughnut charts.
The two key functions are latestAt and balancesAt:
latestAt(account, date)— finds an account’s most recent record on or before a given date.balancesAt(date)— computes the effective balance of every account on a given date.
Together they’re what makes “only log the accounts that changed” work naturally.
Daily Workflow
Day to day, you only ever touch the data file:
- Open
data/asset_snapshots.md. - Copy an existing row.
- Update the date, category, account and amount.
- Optionally note the reason: “spending”, “transfer in”, “market move”.
- Open
asset-trends.mdto see the refreshed charts.
If a brokerage account moves from 120000 to 122000, that’s one new line:
| |
Nothing else needs to be re-entered.
Practical Tips
To keep the data usable over the long run, a few simple rules help:
- Keep account names stable. Writing “CMB” today and “China Merchants Bank” tomorrow creates two separate accounts.
- Keep the date format consistent. Stick to
YYYY-MM-DDso sorting works. - Put digits only in
amount. No currency symbols, thousands separators or units. - Record totals for investment accounts. For stocks, funds and wealth products, log “market value + cash”.
- Back up the vault. The data is local, which also means nothing recovers it for you if a device dies.
If the data feels sensitive, you can give this folder its own sync rules, or keep it strictly on one local device and exclude it from cloud sync entirely.
Where to Take It Next
The basic dashboard leaves plenty of room to grow:
- Add liabilities and compute net worth.
- Add monthly and annual rates of return.
- Support multiple currencies per account.
- Add a bar chart comparing asset size month over month.
- Add a target line to see how far you are from a milestone.
- Break assets into higher-level buckets: cash, equity, fixed income.
If the dataset grows large, split it by year into several Markdown files and have DataviewJS load them together.
Conclusion
The value here isn’t building an elaborate financial system — it’s letting Obsidian accumulate your asset history and turn it into a trend dashboard you can keep watching.
Markdown keeps the data readable and backup-friendly, DataviewJS does the math, and Charts handles the display. Maintain a handful of records now and then, and over time you get a clear, honest view of how your total assets, category mix and account distribution are evolving.